
In Development
IoT Dashboard
Build a screen around the readings that matter to you.
IoT Dashboard is a desktop app for viewing equipment readings, following trends and sending supported control signals to your IoT Devices from screens you arrange yourself.
Inside the development build
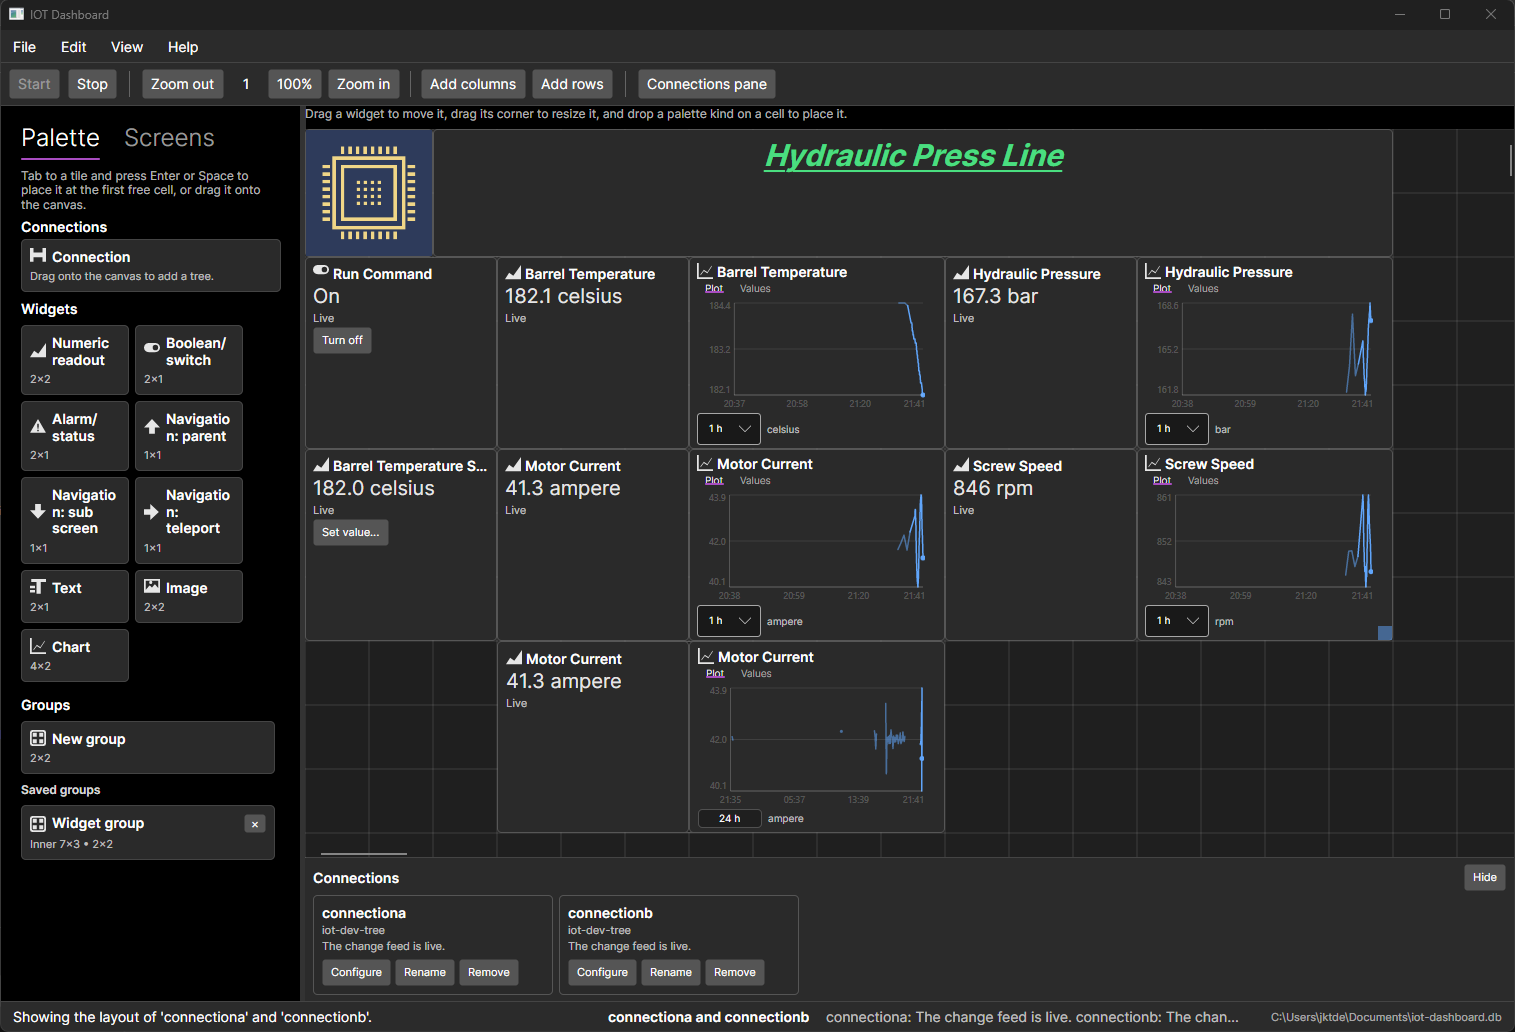
This screen brings a simulated press line’s temperatures, pressure, motor current and speed together with charts and controls. Select the screenshot to view it at full size.
What the current build can do
Arrange your own screens
Drag and resize small panels, called widgets, on a grid. Put the readings you need together, add more screens and place navigation buttons to move between them.
Read values at a glance
Show numbers, on/off states and alarm conditions as the server updates them. Choose compatible display units, such as Celsius or Fahrenheit, and colour numeric readings using limits you set.
Keep useful context alongside readings
Add a photo, a heading or instructions to explain a screen. Format your notes so the person using the dashboard can see what each area is for.
Reuse a panel you’ve built
Group related widgets and reuse the group on other screens in the same dashboard. Editing a shared group updates its other copies; detach a copy when it needs its own layout.
Watch several connections
Display readings from more than one dashboard server. Each connection reports its own status, so an unavailable server does not stop the others updating.
See when a reading needs attention
Widgets distinguish live readings from stale, missing or disconnected values. If equipment disappears from the server’s list, its widgets stay in your layout and report the problem.
Look back at how a reading changed
Give a numeric reading its own chart and choose the last hour, 24 hours, 7 days or 90 days. Charts use stored readings averaged into time intervals, with gaps where nothing was recorded. Point at the chart to inspect a value, or use its Values tab to read the samples as a list.
The server retains reading history for 90 days. A chart can only show what that server has recorded, so a new installation will not already have 90 days of readings.
Your screens on your computer
Your layouts and connection settings are saved in a local dashboard file. Readings and their history come from the separate dashboard server, which can run on the same computer. The app does not require a cloud account, but it does need a connection to that server for live readings and history.
Connections use certificates to identify the server and your installation. The server decides which installations can only view readings and which may also send controls.
Where development stands
The features above are implemented in the current development build. The app has not been released, and there is no announced release date or price.
- Real-device connectors and the companion app for editing the equipment list are planned and not yet available.
- The current connection setup uses Windows certificates. Support for other desktop platforms is planned.
- Dial-style gauges, undo and a permanent record of control actions are also planned.
Interested in IoT Dashboard?
I’d like to hear which readings you need to see together and what would make a dashboard useful for your project. Get in touch to ask about development or share your requirements.